Reviewing Video Analytics
Regardless of your specific goals for online video, understanding your audience is a key to developing a successful video strategy. The better you understand your viewers, the easier it is to create content that will engage them in formats they can easily consume. The Analytics page provides analytics about how many views your videos have, how much content your viewers are watching and even when they stop watching videos.
To view Analytics in Brightcove Engage™, click Analytics in the navigation header.
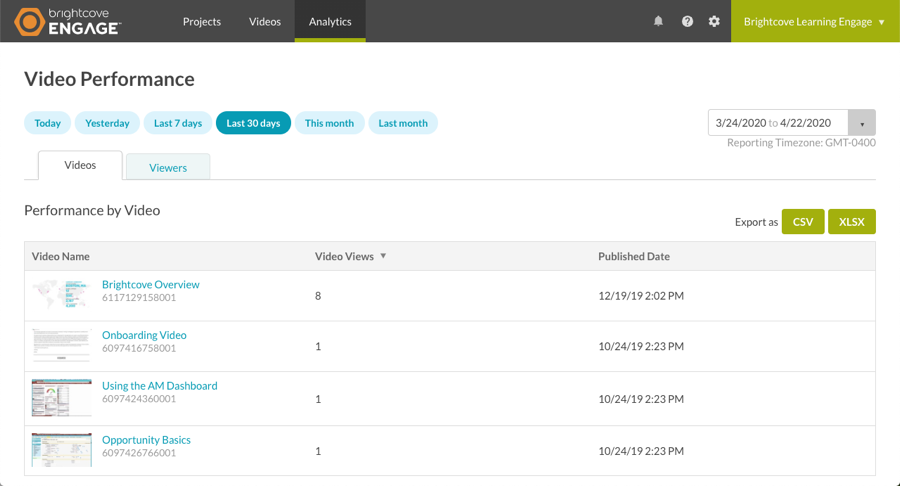
The Videos tab will be selected by default. The following details will be displayed:
- Video Name and ID
- Video Views - The number of times a video started playing, recorded when the stream is started
- Published Date - The date the video was uploaded
Selecting a time span
To specify the time period for analytics, click on a quick date or use the calendar control. Note that when a single day is selected, the graphs will display by hour.
Using a quick date
A series of quick dates are at the top of the page. The following quick dates are available:
- Today
- Last 7 days
- Last 30 days
- This month - The calendar month to date - for example, if today is March 17, this report will display March 1 - March 17
- Last month - The previous calendar month - for example, if today is February 14, this report will display January 1 - January 31.

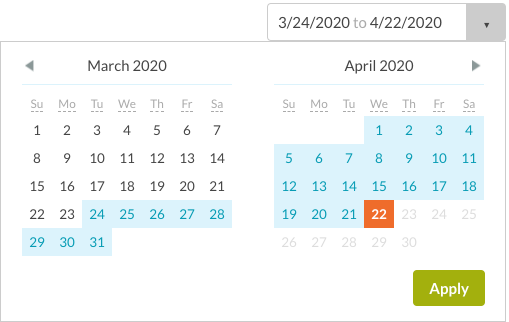
Using the calendar control
You can also select a start and end dates by clicking on the calendar control.
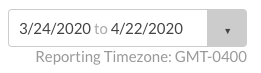
Reporting time zone
Data on the Analytics page is shown using the account's reporting time zone. The time zone is displayed below the calendar control.
The reporting time zone is used to calculate day boundaries for reporting data. Changing the reporting time zone setting only affects data going forward, and changes are not applied retroactively. If you change this setting, you may see a flat spot or a spike in your data when looking at day boundaries where the change was applied. Updates to this setting may not take effect immediately, and analytics data may continue to refer to the old setting until the system processes the changes.
The reporting time zone can be configured as part of the account settings. For information on changing the reporting time zone, see Managing Account Settings.
Viewing analytics for a video
To view detailed analytics for a specific video, click on the Videos tab and then a video name.
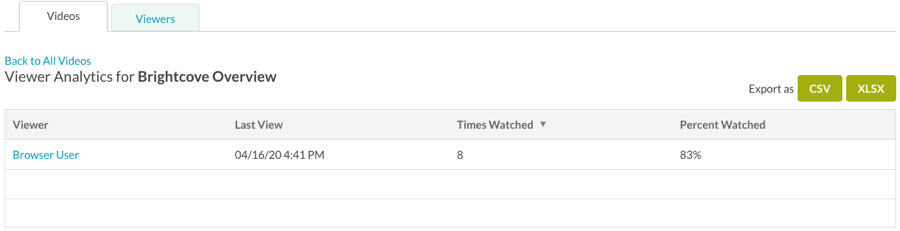
The following details will be displayed:
- Viewer - The viewer name, this may display Browser User if the viewer name is unknown
- Last View - Last date and time the viewer watched the video
- Times Watched - The number of times the video started playing
- Percent Watched - The total percent watched over all the user's sessions
Viewing viewer analytics
To view viewer analytics, click on the Viewers tab. A list of all viewers who have viewed videos during the selected time period will be displayed.
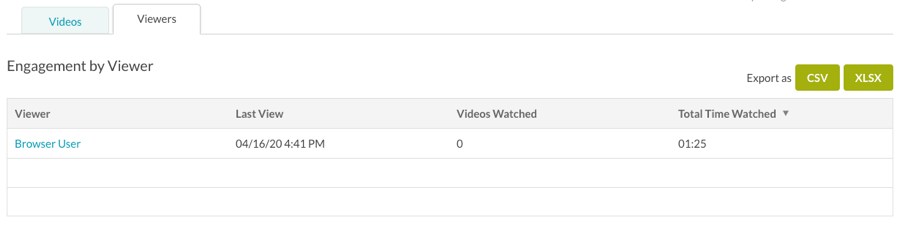
The following details will be displayed:
- Viewer - The viewer name, this may display Browser User if the viewer name is unknown
- Last View - Last date and time the viewer watched the video
- Videos Watched - The number of videos the user watched
- Total Time Watched - The total viewing time for the viewer
Exporting analytics data
To export analytics data, follow these steps.
- Click on a quick date or use the calendar control to select a date range.
- Click the appropriate link to export the data as a CSV or XLSX file.